

The perfect design doesn’t exist, but it’s our responsibility as engineers to address and resolve design issues as we find them to minimize those imperfections. However, replicating and root-causing those issues can seem like full projects themselves. What if you’ve seen evidence of an underlying issue, but can’t replicate it (like how your car never makes that sound when you show the mechanic), or you’ve never even seen evidence despite the issue absolutely existing (just because I never saw any flickering lights didn’t mean my house didn’t have faulty wiring). With the right tools, we can be sure to uncover and capture the problematic behavior to ultimately lead us to correcting and improving our designs. Here I’ll go over four excellent debugging tools you can use on an oscilloscope to find and fix your troublesome signals.
Mask Testing
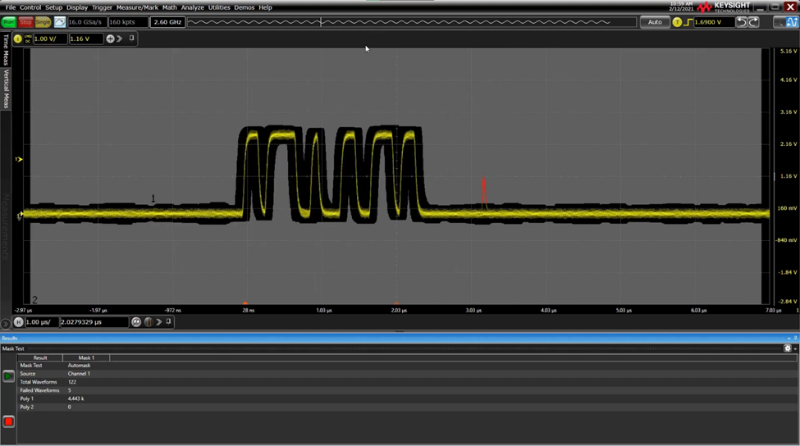
You’re probably familiar with configuring triggers to capture some type of unwanted behavior in your signal – slow edges, fast edges, glitches, and runts, among others. If you know the type of anomaly you’re looking for, configuring a specific trigger is easy enough, but what if you want to capture anything that strays from the expected? That’s where mask testing can help.
Mask testing comes in handy when you have a “golden trace” – an expected behaviour that a signal should follow, allowing for some deviation around that golden trace. If a signal strays outside of a defined mask, a failure is captured so you can investigate and debug the behaviour. This type of test is also known as “limit testing” or “pass/fail testing”.
There are a few things you’ll want to consider when choosing a scope that offers mask testing:
- Hardware-acceleration – some scopes perform mask testing purely through software processing, but this can result in delayed results and potential misses when compared to hardware-accelerated testing
- Automatic mask creation – maybe you want to enforce specific limits (millivolts or percentages) around your trace. Auto mask creation allows for quick mask setup with user-specified limits.
- Mask drawing – maybe your limits vary along the trace. The ability to quickly draw your mask using the touchscreen can come in handy for being strict in some areas and lenient in others.
- Continuous logging – this is handy if you want to get an idea of how often your mask testing results in failure, especially if you’re trying to determine if the failure rate is within acceptable rates.
- Multi-channel testing – the ability to mask test on all channels simultaneously comes in handy when you’re analyzing multiple points of a circuit, such as a power IC during power-on sequencing.
Segmented and Historical Memory
One feature I appreciate in modern home security systems is the ability to capture only the video clips I care about. Instead of wasting valuable storage with a 24-hour recording of seeing the shadows move across my front yard, I instead save a couple 30-second clips of packages being delivered. This same principle applies to many of the signals you may be capturing on your scope.
Many digital signals stay “quiet” the majority of the time, bursting only when needed to save power. Capturing the behavior around these bursts would be an inefficient use of the scope’s high-speed onboard memory. By using segmented memory, you can configure your scope to capture only the area of interest around a trigger, sending the waveform to high-speed memory and minimizing the dead time between captures. This ensures efficient use of memory while also minimizing the risk of missing an elusive event.
If a segmented acquisition wasn’t configured, there’s another tool at your disposal to help see infrequent events – history mode. With history mode, you can view historic waveforms that were stored to memory upon previous triggers, which is extremely helpful if you finally see the behaviour you’ve been waiting for, but the scope triggers again, replacing the trace on the screen with one you’re not interested in. If your scope supports history mode, just stop the acquisition and navigate back to a previous waveform.
Zone Triggers
A key part of the word oscilloscope is “scope”, designating the instrument as a visual tool. While the technology has advanced incredibly under the hood, we still often rely on our eyes to notice anything out of the ordinary in our trace. Everybody has had the experience of viewing a signal on your scope, only to see a sudden, unexpected event that vanishes as quickly as it appeared. You don’t know exactly when the event happened, but you do know you saw a signal inhabiting a part of the display it wasn’t supposed to inhabit.
This is where zone triggers can help. By defining specified areas of the display as trigger “zones”, you can capture those elusive events that you can only describe visually. In Keysight Infiniinium scopes, this is accomplished through InfiniiScan software.
Fault Hunter
As I mentioned before, there are many types of anomalies that can occur in a digital signal, but there are a few that are much more common than others: glitches, runts, and slow edges. With that in mind, Keysight developed a unique, automated tool called Fault Hunter, designed to quickly analyze your signal, develop a model, and spot deviations from that model.
This saves precious time by avoiding the need to closely watch our signal in real-time, visually spot anomalies, define triggers or tests to capture those anomalies, and go through these motions all over again when the parameters of our signal change. With Fault Hunter you can set up automated analysis of your signal over anywhere from one minute to 48 hours, allowing you to spend more time focused on problem-solving and less time figuring out where to start.
To learn more about Fault Hunter and the debugging capabilities of Keysight oscilloscopes explore the application note: Infiniium EXR and MXR-Series Oscilloscopes: Quickly Find and Identify Hidden Signal Errors
TestEquity are an approved UK partner for Keysight
Content Source: https://blogs.keysight.com/blogs/tech/bench.entry.html/2022/09/27/4_killer_tools_fordebuggingonascope-eWSZ.html


